A compact full-stack demo of an IoT telemetry monitoring pipeline for a mock greenhouse. It showcases the core patterns of a real-time IoT dashboard:
- Device telemetry ingestion — sensor readings arrive via a streaming simulator and a bulk REST endpoint (the same path a real gateway would use).
- Real-time fan-out — new readings and alerts are pushed to every connected client over SignalR (WebSockets).
- Edge-style anomaly detection — a rolling-window z-score check flags out-of-range temperature, humidity, and CO₂ values on the fly.
- Live operations dashboard — sensor cards with status colors, an anomaly feed, a trend chart, and a connection/heartbeat indicator.
Stack: .NET 10 (ASP.NET Core, SignalR, in-memory) · Angular 21 (standalone + signals, zoneless, RxJS) · Angular Material + Tailwind · Chart.js
Live dashboard — sensor cards, anomaly feed, and trend chart updating in real time:

Video walkthrough (click to play on YouTube):
Components & data flow — both telemetry sources feed one pipeline, which fans out over REST (pull) and SignalR (push):
flowchart LR
    SIM["Sensor simulator (~2s)"]
    POST["POST /api/readings"]

    subgraph SERVER[".NET server"]
        ING["Ingest + z-score detection"]
        STORE[("In-memory store<br/>last 20 + anomalies")]
        ING --> STORE
    end

    UI["Angular dashboard<br/>cards · anomalies · chart"]

    SIM --> ING
    POST --> ING
    ING -->|SignalR push| UI
    STORE -.->|REST hydrate| UI
Runtime loop — what happens on every reading:
sequenceDiagram
    autonumber
    participant S as Source (sim / POST)
    participant I as ReadingIngestor
    participant D as AnomalyDetector
    participant R as ReadingsStore
    participant H as SignalR hub
    participant C as Angular client

    S->>I: SensorReading
    I->>D: detect(reading, current window)
    D-->>I: anomalies if z-score over 2.5σ
    I->>R: store reading (+ anomalies)
    I->>H: ReadingReceived (+ AnomalyDetected)
    H-->>C: WebSocket push
    C->>C: update cards, chart, anomaly feed
- One pipeline, two sources. The
SensorSimulatorandPOST /api/readingsboth callReadingIngestor, so simulated and "real" telemetry behave identically (assign metadata → detect → store → broadcast). - Detect against history, then store. Detection runs over the current window before the new reading is added, so a value is scored against prior history rather than itself.
- In-memory window.
ReadingsStorekeeps the last 20 readings (detection + chart window) and recent anomalies — no database. - Two transports. REST for request/response + initial hydrate; SignalR for
live
ReadingReceived/AnomalyDetectedpush and a clientHeartbeat. The Angular dev server proxies/apiand/hubsto the backend. - LIVE/OFFLINE combines the browser online state with the hub heartbeat.
- .NET SDK 10
- Node.js 22.12+
- Docker (optional, for the containerized Docker run path)
npm install # installs client deps + restores server (postinstall)Both apps together (client on :4200, server on :5255):
npm startThen open http://localhost:4200. The Angular dev server proxies /api and
/hubs to the backend, so no extra config is needed.
npm run server # dotnet run --project server --launch-profile http- REST API:
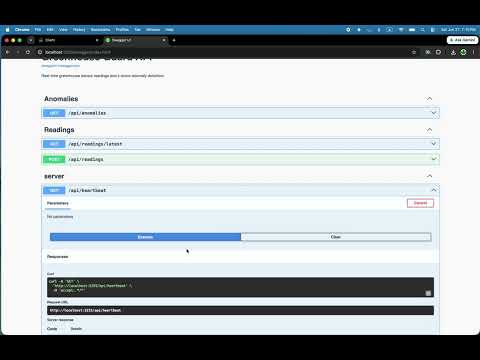
GET /api/readings/latest,POST /api/readings,GET /api/anomalies - SignalR hub:
/hubs/sensors - Swagger (Development): http://localhost:5255/swagger
npm run client # ng serve (requires the backend running for live data)Both apps together as containers (client on :4200, server on :5255):
npm run docker # docker compose up --buildThen open http://localhost:4200. The client image is nginx serving the
Angular production build; it reverse-proxies /api and /hubs (including the
SignalR WebSocket upgrade) to the server container over the compose network,
so the browser only ever talks to one origin and no CORS is involved. The
server image is the published .NET app on an Alpine ASP.NET Core runtime.
npm run docker:down # stop and remove the containersImages are also published automatically to GHCR on every push to main and
on version tags (vX.Y.Z) via .github/workflows/docker-publish.yml:
ghcr.io/ssokurenko/dotnet-angular-server and ghcr.io/ssokurenko/dotnet-angular-client.
Stream docker-compose.ghcr.yml straight into
docker compose — one command, nothing saved to disk:
curl -fsSL https://raw.githubusercontent.com/ssokurenko/dotnet-angular/main/docker-compose.ghcr.yml | docker compose -p dotnet-angular -f - up -dThen open http://localhost:4200 — same routing as the local build (client
nginx proxies /api and /hubs to the server container). Stop it with:
curl -fsSL https://raw.githubusercontent.com/ssokurenko/dotnet-angular/main/docker-compose.ghcr.yml | docker compose -p dotnet-angular -f - downnpm test # server (xUnit) + client (Vitest)Focused on the critical logic: z-score anomaly detection, the rolling-window store, and the client state service (window/anomaly caps).
- Single, simulated sensor source — a hosted
BackgroundServicegenerates a reading every ~2s (with periodic spikes); no real hardware. - In-memory only — readings (last 20) and anomalies are not persisted; state resets on restart. No database, no auth (per the brief).
- Local dev setup — HTTP profile, CORS limited to
localhost:4200, Swagger enabled only in Development.
- Authentication & authorization — secure the REST API and SignalR hub (e.g. JWT), with per-user roles for viewing vs. managing facilities.
- Multiple greenhouse facilities — model many sites/devices, scope readings and anomalies per facility, fan out via per-facility SignalR groups, and add a facility switcher to the dashboard.
- Offline queue (localStorage + retry on reconnect)
- Persistence — swap the in-memory store for a database
- More test coverage — integration/E2E tests beyond the few unit tests.