Microseismicity events happen during the process of hydraulic fracturing and are used to interprete the dimension and direction of the hydaulic fractures. For more information about the usage of microseismicity interpretation, one can refer to Maxwell (2010).
Dataset includes the microseismicity data (3D coordinates (x, y, z), time, magnitude, calculated distance from the well) and the 5 industrial records (surface pressure, injection rate, proppant concentration, toal concentration volume, toal injection fluid volume). These data comes from 3 neigbouring horizontal wells and each well has about 20+ stages. Each stage can be approximately treated as an individual fracturing process.
We want to use the recorded industrial parameters to predict the triggering front (i.e. the farthest distance of the microseisimity at time t).
The main procedure to solve this problem is listed as follows:
1)Raw data:
Features are the 5 industrial records mentioned above and they are recored every second (continuous datapoints in time). Microseismicity events are recorded at the happening time and their space coordinates & magnitudes are also recorded (discrete datapoints in time). Label is the triggering front of microseimicity which needs to be extracted from the raw seismic data.
Triggering front (Shapiro, 2009) is based on the theory of fluid diffusion and pore pressure perturbation. In theory the triggering front is a monotonically increasing curve (just like the fluid diffusion process).
2)Data preprocessing:
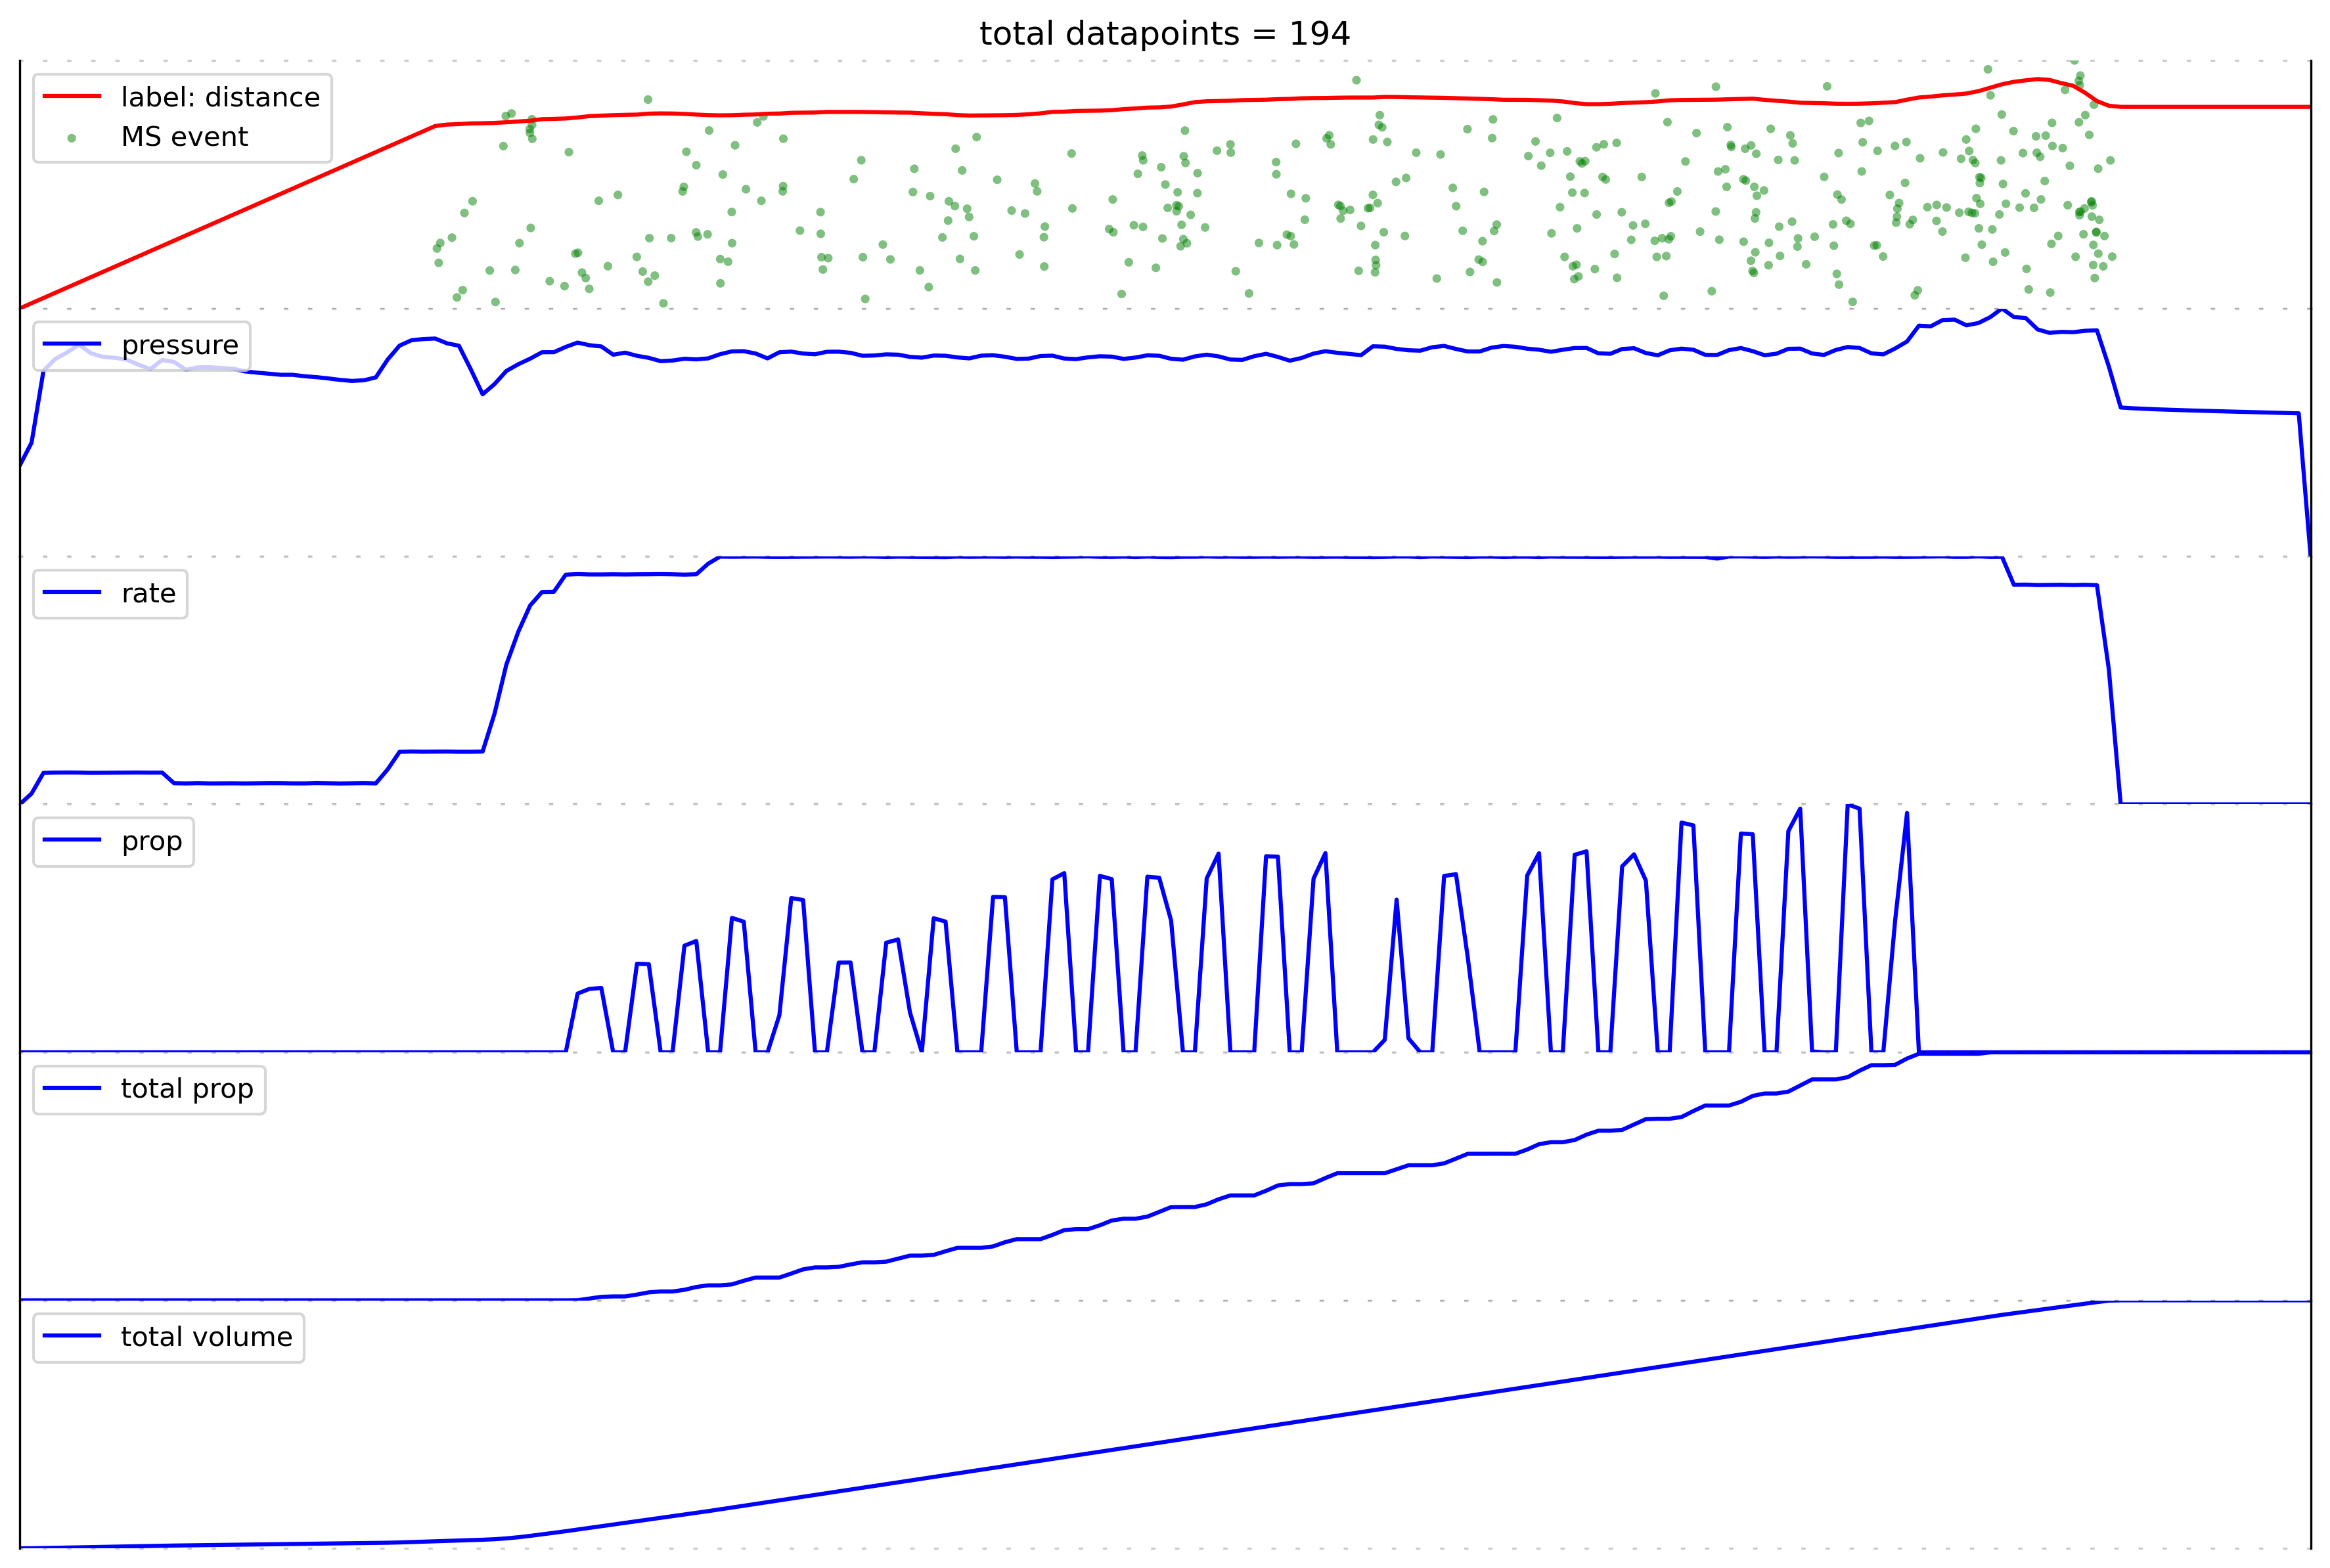
Features do not need to be processed while label has to be extracted from the raw data. Firstly, we use the sptio-temporal DBSCAN algorithm to exclude some abnormal seismic events (usually referred as 'dry events' (Maxwell, 2015). Then we calculate each event's distance from the injection well. We use the locally-weighted scatterplot smoothing algorithm to get the continuous 'triggering front' from the discrete seimic events' distance (linear interpolation used). So far we have obtained both features and according label every second and we also apply a downsampling at frequency of 1 min to reduce the datapoints. The final features-label relation of one stage is shown in below figure:
3)LSTM with fully-connected layer model:
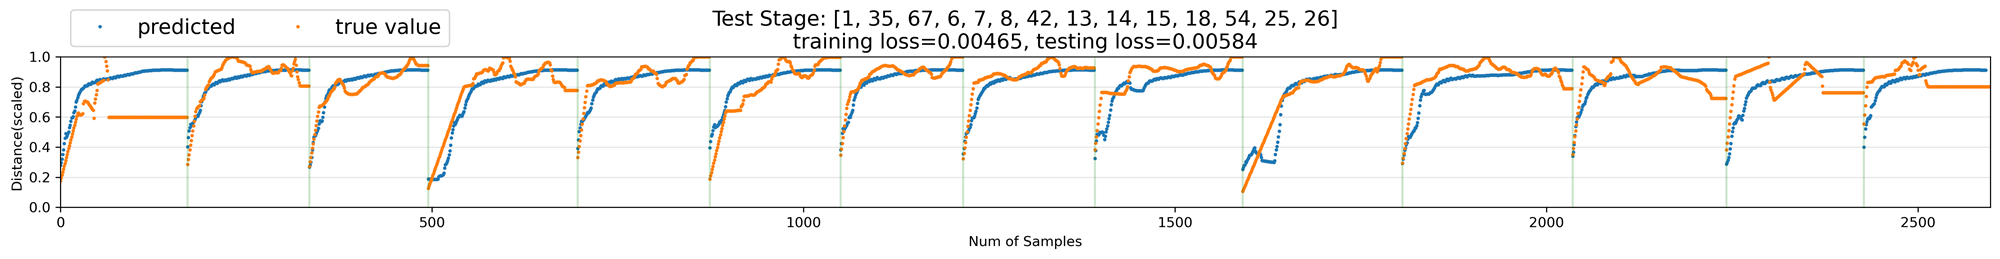
We want to use the past 10 min industrial parameters to predict the last 1 min triggering front distance. So a overlapping sliding time window is applied to generate the training dataset. Notice that we divide training samples on each stage and concatenate them as a whole dataset because we think each stage is approximately an individual process. So the input tensor dimension into the LSTM model should be (batch_size, sequence_length=10, input_size=5) and the output tensor of the model should be (batch_size, 1, 1)
The performance is not good:
This work has been submitted to the International Society of Rock Mechanics Congress (2023), see below: