Lightweight monitoring for your tmux status line

- Features
- Quick Start
- Requirements
- Installation
- Usage
- Configuration
- Advanced: Templates
- Similar Projects
- License
- Load Average — System load (1, 5, 15 minute averages)
- Memory — RAM usage with customizable thresholds
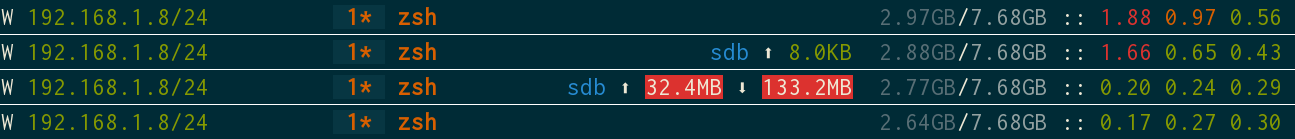
- Network — Interface stats with bandwidth per second
- Disk — Filesystem usage and availability ✨ NEW in 1.0!
- I/O — Disk read/write statistics
- Sensors — CPU/system temperatures from hwmon
- Journal — systemd journal error monitoring ✨ NEW in 1.0!
- Go Templates — Flexible formatting for sensors, disk, and journal
- Color Intervals — Automatic color coding based on thresholds
- Zero Config — Sensible defaults, override only what you need
Install:
go install github.com/TomasTomecek/tmux-top/cmd/tmux-top@latestAdd to tmux:
tmux set -g status-right "#(tmux-top m) :: #(tmux-top l)"Done! You'll see memory usage and load average in your tmux status bar.
- Go: 1.21 or later (for building from source)
- OS: Linux (uses
/proc,/sysfilesystems) - Optional: systemd/journalctl (for
journalcommand) - Optional: lm-sensors (for
sensorscommand)
go install github.com/TomasTomecek/tmux-top/cmd/tmux-top@latestBinary will be installed to $(go env GOPATH)/bin/tmux-top.
Make sure $(go env GOPATH)/bin is in your PATH:
export PATH="$(go env GOPATH)/bin:$PATH"git clone https://github.com/TomasTomecek/tmux-top.git
cd tmux-top
make
sudo make installThis installs the binary to /usr/bin/tmux-top.
| Command | Alias | Description | Example Output |
|---|---|---|---|
load |
l |
System load averages | 0.5 1.2 0.8 |
mem |
m |
Memory usage | 8.2G/16G |
net |
n |
Network statistics | W:192.168.1.5 ↓2.1M ↑0.5M |
io |
i |
I/O statistics | sda:↓1.2M ↑0.3M |
disk |
d |
Disk usage | /: 45% (250G free) |
sensors |
s |
Temperature sensors | Temp: 52 53 51 |
journal |
j |
Journal error counts | J 13 (colored) |
Examples:
# System load
tmux-top load
tmux-top l

# Memory usage
tmux-top mem
tmux-top m

# Network stats
tmux-top net
tmux-top n

# Journal errors (last hour)
tmux-top journal --timeframe=1h
tmux-top j -t 5mSimple setup:
tmux set -g status-right "#(tmux-top m) :: #(tmux-top l)"Full monitoring:
tmux set -g status-left "#(tmux-top n)"
tmux set -g status-right "#(tmux-top m) :: #(tmux-top l) :: #(tmux-top j) :: #(tmux-top s)"
With custom refresh interval:
tmux set -g status-interval 5
tmux set -g status-right "#(tmux-top m) :: #(tmux-top l)"
Persistent configuration (add to ~/.tmux.conf):
set -g status-interval 5
set -g status-left "#(tmux-top n)"
set -g status-right "#(tmux-top m) #[fg=white]:: #(tmux-top l) #[fg=white]:: #(tmux-top j)"
Layout inspiration from this blog post.
Configuration is optional. tmux-top works with sensible defaults out of the box.
Create ~/.tmux-top to override defaults. Only specify what you want to change.
Full default configuration: conf/default_json.go
{
  "net": {
    "interfaces": {
      "wlp3s0": {
        "alias": "W",
        "label_color_fg": "white",
        "label_color_bg": "default",
        "address_color_fg": "green",
        "address_color_bg": "default"
      },
      "enp0s25": {
        "alias": "E",
        "label_color_fg": "white",
        "address_color_fg": "colour4"
      },
      "tun0": {
        "alias": "V",
        "address_color_fg": "colour3"
      }
    }
  }
}{
"sensors": {
"template": "{{range $i, $device := .Devices}}{{if eq $device.Name \"coretemp\"}}{{if gt $device.HighValue 70.0}}🔥 {{range $j, $e := $device.Stats}}{{$e.CurrentTemp}} {{end}}{{end}}{{end}}{{end}}"
}
}{
"journal": {
"intervals": [
{"to": "1", "bg_color": "default", "fg_color": "green"},
{"from": "1", "to": "5", "bg_color": "default", "fg_color": "yellow"},
{"from": "5", "to": "10", "bg_color": "yellow", "fg_color": "black"},
{"from": "10", "bg_color": "red", "fg_color": "white"}
]
}
}- Intervals — Color thresholds for load, memory, disk, journal
- Templates — Go templates for sensors, disk, journal output
- Interface aliases — Short names for network interfaces
- Colors — tmux color codes (fg/bg) for all elements
The sensors, disk, and journal commands support Go templates for custom output formatting. This allows complete control over what data is displayed and how it's formatted.
The sensors command provides flexible temperature monitoring using Go templates. The template receives a SensorsStats struct containing data from /sys/class/hwmon/*.
Inspect available data:
tmux-top sensors --format '{{.|printf "%#v"}}'Output:
sens.SensorsStats{Devices:[]sens.DeviceStat{sens.DeviceStat{Name:"acpitz", LowValue:48, HighValue:48, Stats:[]sens.TemperatureStat{...}}}}
List available sensors:
tmux-top sensors --format '{{range $i, $device := .Devices}}{{.Name}}: {{.|printf "%#v\n"}}{{end}}'Output:
acpitz: sens.DeviceStat{Name:"acpitz", LowValue:45, HighValue:45, Stats:...}
pch_wildcat_point: sens.DeviceStat{Name:"pch_wildcat_point", LowValue:48, HighValue:48, Stats:...}
iwlwifi: sens.DeviceStat{Name:"iwlwifi", LowValue:42, HighValue:42, Stats:...}
coretemp: sens.DeviceStat{Name:"coretemp", LowValue:46, HighValue:46, Stats:...}
Data structure:
Devices— Array ofDeviceStatstructsDeviceStatfields:Name— Sensor name (may be empty)LowValue— Minimum temperature across all readingsHighValue— Maximum temperature across all readingsStats— Array ofTemperatureStatwith individual readings
TemperatureStatfields:Label— Reading label (e.g., "Core 0", "Package id 0")CurrentTemp— Current temperature value
Display all temperatures:
tmux-top sensors --format '{{range $i, $device := .Devices}}{{.Name}}: {{range $j, $stat := .Stats}}{{.CurrentTemp}} {{end}}{{printf "\n"}}{{end}}'Output:
acpitz: 44
pch_wildcat_point: 46.5
iwlwifi: 42
coretemp: 45 45 44
Default template (shows CPU temp only when > 50°C):
tmux-top sensors --format '{{range $i, $device := .Devices}}{{if eq .Name "coretemp"}}{{if gt $device.HighValue 50.0}}Temp: {{range $j, $e := $device.Stats}}{{$e.CurrentTemp}} {{end}}{{end}}{{end}}{{end}}'Output:
Temp: 67 67 67
With tmux color formatting:
tmux-top sensors --format '{{range .Devices}}{{if eq .Name "coretemp"}}{{range .Stats}}{{if gt .CurrentTemp 70.0}}{{tmux_display "default" "red" .CurrentTemp}}{{else}}{{tmux_display "default" "green" .CurrentTemp}}{{end}} {{end}}{{end}}{{end}}'The journal command monitors systemd journal for errors, warnings, and critical messages.
Data structure:
tmux-top journal --format='{{.|printf "%#v"}}'Output:
journal.JournalStats{TimeFrame:"1h", ErrorCount:13, WarningCount:0, CriticalCount:437, TotalCount:450}
Fields:
TimeFrame— Time window being monitoredErrorCount— Number of error-level messages (priority 3)WarningCount— Number of warning-level messages (priority 4)CriticalCount— Number of critical/alert/emergency messages (priorities 0-2)TotalCount— Sum of all error, warning, and critical messages
Timeframe options:
tmux-top journal --timeframe=1h   # Last hour (default)
tmux-top journal --timeframe=5m   # Last 5 minutes
tmux-top journal --timeframe=24h  # Last 24 hours
tmux-top journal -t 1h            # Short form
Compact error display:
tmux-top journal --format='{{if gt .ErrorCount 0}}E:{{.ErrorCount}} {{end}}{{if gt .WarningCount 0}}W:{{.WarningCount}}{{end}}'Output:
E:13
Detailed display:
tmux-top journal --format='{{if gt .ErrorCount 0}}Errors: {{.ErrorCount}}{{end}} {{if gt .WarningCount 0}}Warnings: {{.WarningCount}}{{end}} ({{.TimeFrame}})'Output:
Errors: 13 (1h)
Conditional formatting:
tmux-top journal --format='{{if gt .TotalCount 0}}⚠ {{.TotalCount}} issues{{else}}✓ OK{{end}}'Without --format flag: Displays a simple colored indicator based on error count intervals defined in configuration.
Requirements: systemd and journalctl. If unavailable, displays "Journal unavailable".
The disk command can also use templates for custom output formatting.
Data structure:
tmux-top disk --format='{{.|printf "%#v"}}'Custom format example:
tmux-top disk --format='{{range .Mounts}}{{.MountPoint}}: {{printf "%.1f" .UsedPercent}}% {{end}}'-
tmux_display "bg" "fg" value— Format value with tmux color codes{{tmux_display "default" "colour14" .CurrentTemp}}Yields:
#[bg=default,fg=colour14]65#[bg=default,fg=default] -
replace "old" "new" string— String replacement -
Standard Go template functions:
if,range,gt,lt,eq,printf, etc.
Run tests:
make testBuild:
makeGNU General Public License v2.0 - see LICENSE file for details.