A Reinforcement Learning model that clears traffic in Lagos 59% faster than traditional systems—tested on real maps using SUMO and Deep Q-Networks.
🔥
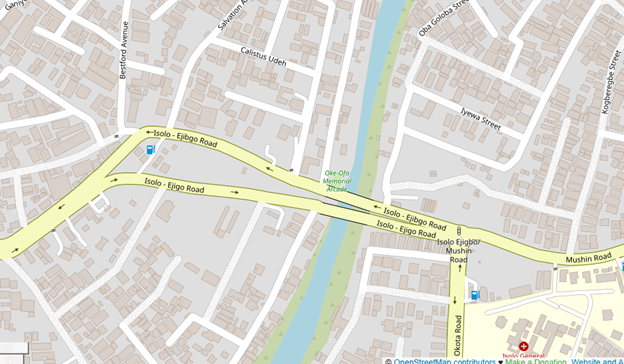
Lagos traffic isn’t just inconvenient—it’s catastrophic. The Oke Afa Roundabout and Isolo–Mushin Corridor are among the city's most congested intersections. Traditional fixed-timing systems collapse under pressure. This project uses Deep Reinforcement Learning to fix that.
Our DQN-based signal controller outperforms traditional systems, cutting travel time by over 30%, increasing speed by 50%, and completing nearly 2x more trips—all in a realistic SUMO simulation built from actual OSM map data.
- Project Goals
- Agents Built
- How It Was Tested
- Performance Highlights
- Demo Video
- Stack and Tools
- Contributing
- What to Do Next
- Author
🎯
To simulate real-world traffic conditions at multiple intersections, including the Oke Afa Roundabout and adjacent junctions.
- Simulate Lagos traffic at key intersections (Oke Afa Roundabout, Isolo–Mushin) using SUMO.
- Train a Deep Q-Network agent to dynamically adapt traffic signals in real-time.
- Benchmark against Fixed-Time and classical Q-Learning agents.
- Measure speed, throughput, emissions, and travel efficiency.
🧠
| Agent | Description |
|---|---|
| ✅ DQN Agent | Learns traffic light timing via neural networks. Maximizes flow, minimizes wait. |
| ⬜ Q-Learning Agent | Table-based RL. Simple but effective baseline. |
| ❌ Fixed-Time Agent | Static signal schedule. Old-school, non-adaptive benchmark. |
🧪
-
SUMO simulation (command-line, 0.5s step size).
-
3,600s runs for Fixed and QL. DQN terminated early due to full network clearance.
-
Output data:
- Trip info
- Emissions (CO2, CO, HC, NOx, PMx, Fuel, Noise)
- Speed, queue length, and travel time
-
Visuals and reports generated with Matplotlib, Excel, and Pandas.
📊
| Metric | Fixed Timing | Q-Learning | DQN |
|---|---|---|---|
| Trips Completed | 1290 | 1519 | 2401 ✅ |
| Avg. Travel Time | 550s | 408s | 361s ✅ |
| Avg. Speed | 4.15 m/s | 5.21 m/s | 6.31 m/s ✅ |
| Simulation Time | 3600s | 3600s | 1446s ✅ |
| Total Emissions | ~13.1B mg | ~12.4B mg | ~14.4B mg ❗ |
| Emissions/Trip | 10.16M mg | 8.16M mg | 6.00M mg ✅ |
DQN cleared all vehicles in under 25 minutes, while others needed a full hour—and still didn’t finish.
🔍 Note: While DQN recorded slightly higher total emissions, it cleared significantly more vehicles. Emissions per trip are still favorable compared to traditional systems.
📁 See full breakdown in results/Traffic metrics report.xlsx
🧭 The chart below shows which road segments (edges) experienced the highest traffic volume during the simulation. This insight helps identify pressure points within the Oke Afa–Isolo corridor.
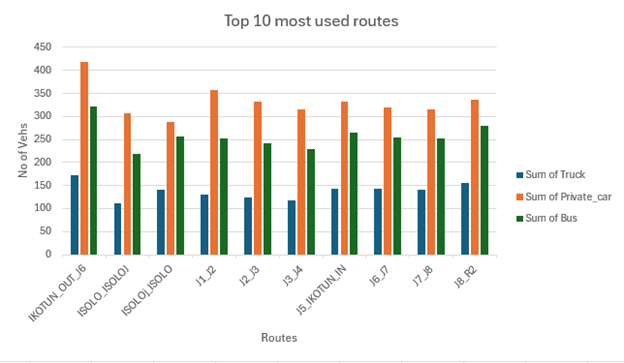
The Egbe–Isolo corridor dominates in vehicle flow intensity. These routes experienced the most traffic pressure, making them prime candidates for adaptive signal control.
Observation : The Egbe Road inbound and outbound links carried the most vehicles, suggesting they’re critical for flow optimization.
📽️
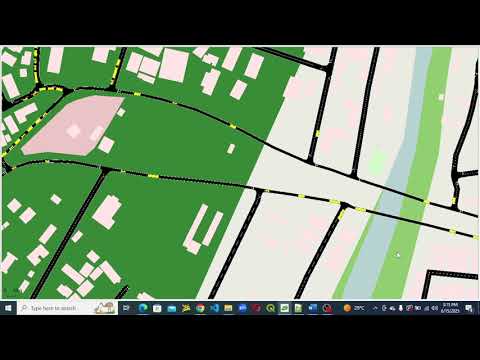
Watch a short demo of the traffic simulation built from real OpenStreetMap (OSM) data. This clip shows the Isolo–Egbe–Oke Afa corridor modeled in SUMO, laying the foundation for the Deep Q-Learning controller.
🧰
- SUMO / NetEdit (network creation and traffic simulation)
- Python: Core logic
- TensorFlow + Keras (DQN Model)
- SumoLib, Traci (interface with SUMO)
- Pandas, Numpy, Matplotlib (data analysis and plotting)
🤝
Got a better RL architecture? Want to simulate a new intersection in Lagos or Nairobi?
PRs and issues welcome.
✅
- Clone and run the sim.
- Watch the demo (coming soon).
- Try your own reward function.
- Open an issue. Let's scale this.
👨💻
Onabanjo Micheal
Engineer | Researcher | Builder
Passionate about AI for urban mobility, intelligent systems, and climate-resilient infrastructure.
🔗 LinkedIn Profile