- Data Mart: A Data Mart is a condensed version of Data Warehouse and is designed for use by a specific department
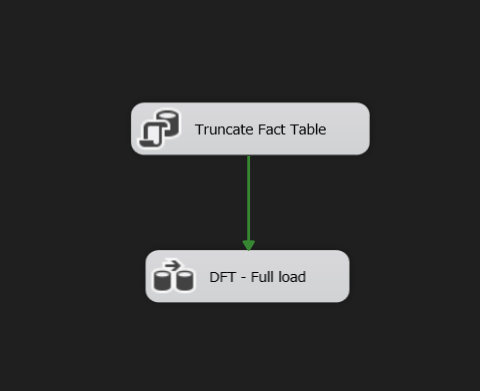
- Full Load: Full Load in ETL is loading ALL the data from the source to the destination. A target table is truncated before loading everything from the source.
- Incemental Load: A selective method of moving data from one system to another. The incremental load model will attempt to compare the incoming data from the source system with the existing data present in the destination.
- 1-Developed a data warehouse, pipelining data from SQL Server using SQL Server Integration Services (SSIS).
- 2-Designed star schema dimensional model on the data warehouse, loading facts and dimensions (Data Modeling).
- 3-Implemented OLE DB Source, Data Conversion, Slowly Changing Dimensions and Derived Column Full load and Incremental load.
- 4-Built Visual dashboards and improved Sales report for sales managers using PowerBI.

- The Business request for this project was an executive sales report for sales managers. Based on the proposition made by the business, the following user stories were defined to fulfill delivery and ensure that acceptance criteria were maintained throughout the project.
- Reporter: Steven – Sales Manager
- Value of Change: Visual dashboards and improved Sales reporting or follow-up or sales force
- Necessary Systems: Power BI, CRM System
- Other Relevant Info: Budgets have been delivered in Excel for 2021

.png)
AdventureWorks2019 (OLTP) from Microsoft https://learn.microsoft.com/en-us/sql/samples/adventureworks-install-configure?view=sql-server-ver16&tabs=ssms
- Customer
- Product
- SalesTerritory
- SalesOrderHeader
- SalesOrderDetail
- Person
- ProductModel
- ProductModelProductDescriptionCulture
- ProductDescription
- Production
- ProductSubcategory
- dim_customer
- dim_date
- dim_territory
- dim_product
- lookup_country
- meta_control_table
- fact_sales
1- Creating the database [EO_AdventureWorksDW2019] by creating the FACT TABLE then creating the DIMENSIONS
2- The FACT TABLE and DIMENSIONS Querries are found on the folder [01-Developed a DWH]
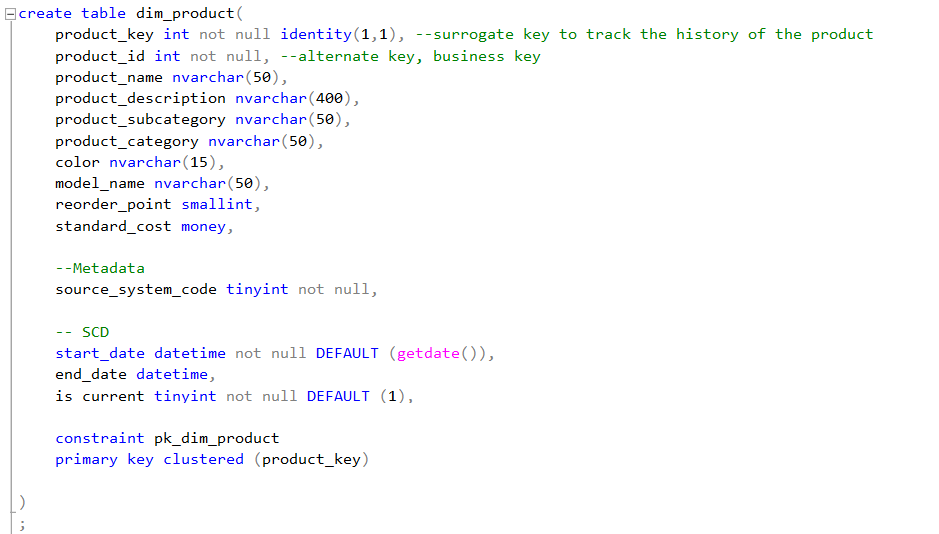

1- Slowly Changing Dimension (SCD)

2- Full load
3- Incremental load


Below is a screenshot of the data model after cleansed and prepared tables were read into Power BI after exporting the DWH into CSV files.
The queries used to extract data into CSV files are in the folder [04.1-To extract data to CSV Files].
This data model also shows how FACT_Budget has been connected to FACT_InternetSales and other necessary DIM tables.

The finished sales management dashboard with one page works as a dashboard and overview, with two other pages focused on combining tables for necessary details and visualizations to show sales over time, per customer, and per product.
You can check the dashboard and try it out!(https://app.powerbi.com/groups/me/reports/7251820f-0346-4bdc-8d17-ed56e29fbeb5/ReportSection)
You can check my Portfolio and try discover other dashboards!(https://yehiakhaledabouzeid.wordpress.com/)
