Visualize how medication decays in the body with an interactive graph! Built with Desmos API and plain HTML, CSS, and JS.
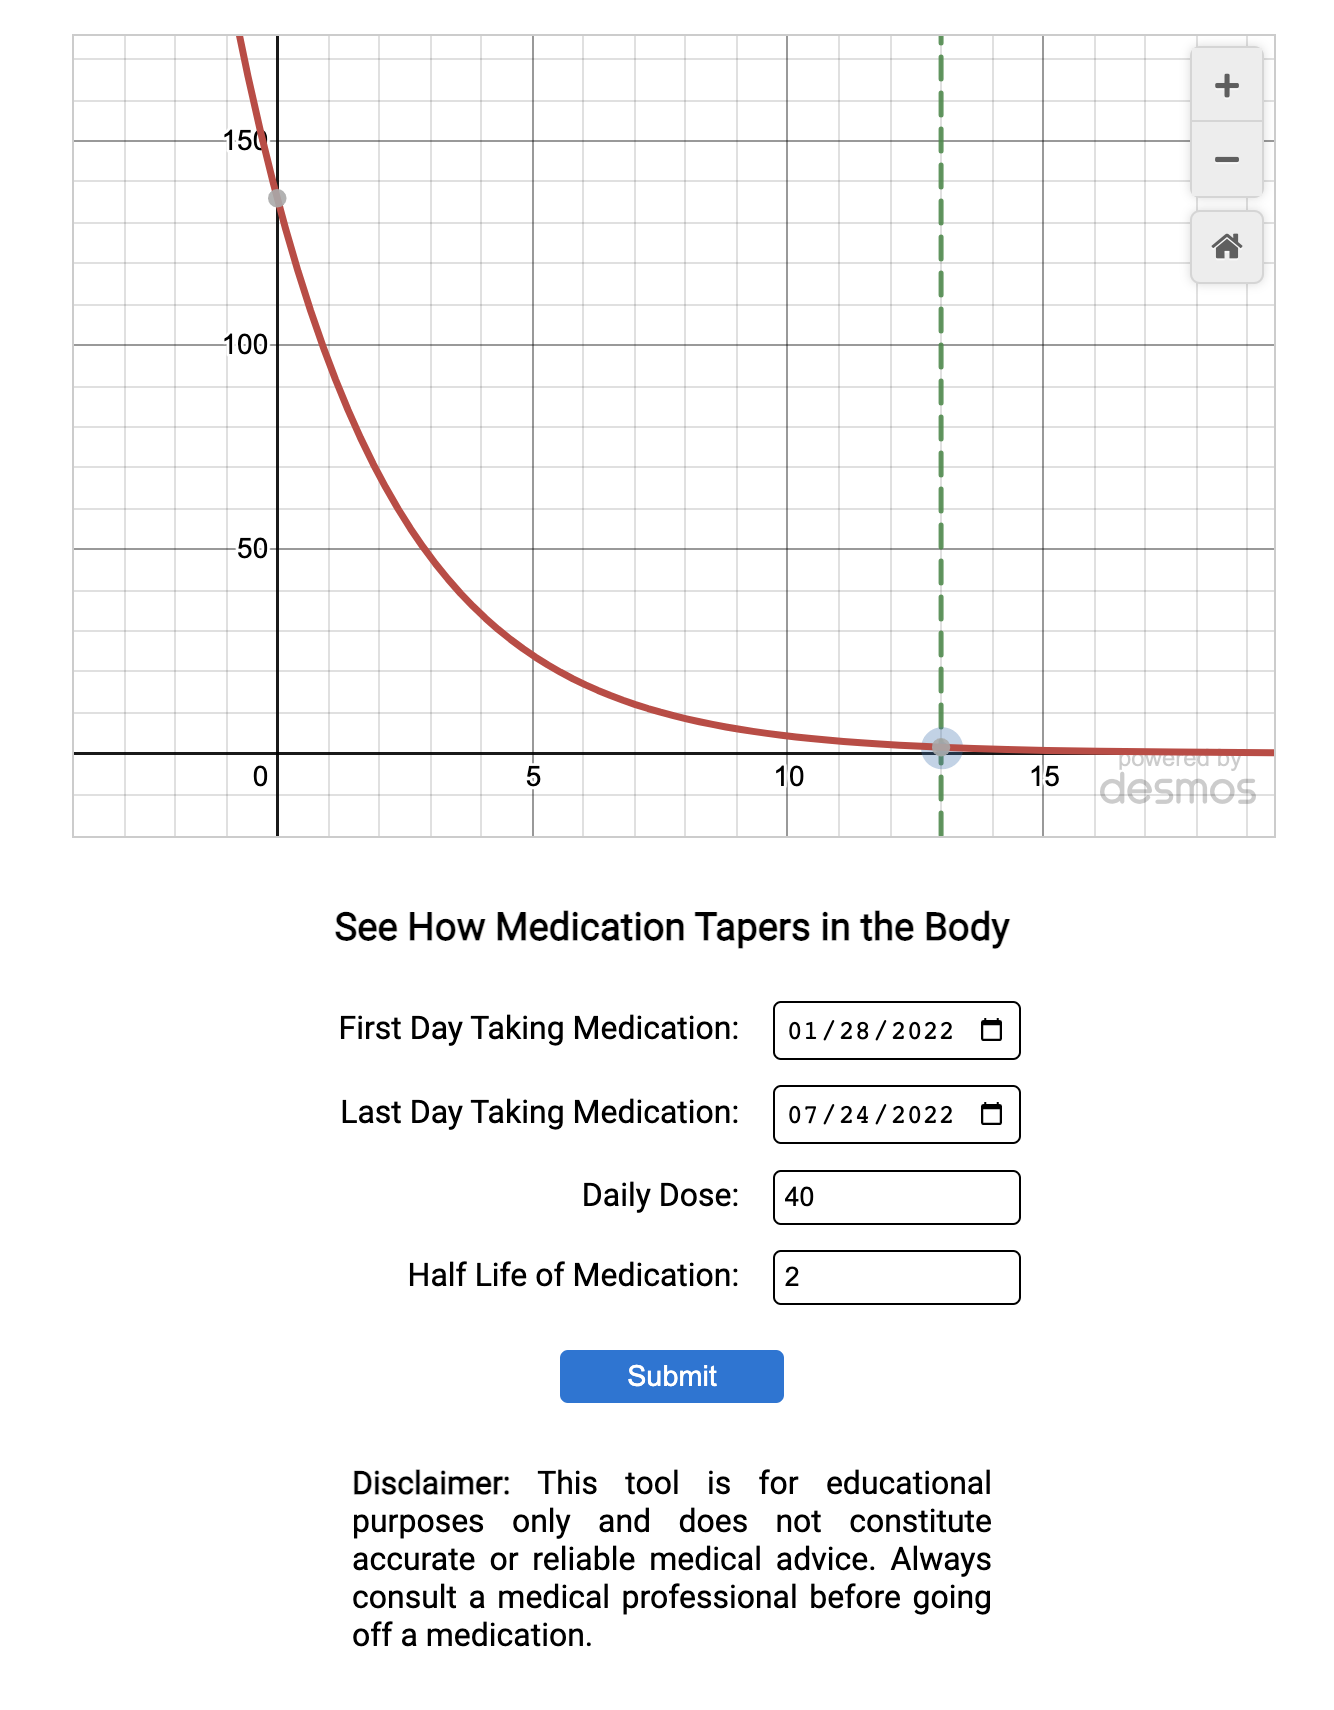
- Interactive graph window
- Enter custom medication start/end date, dose, and half-life
- Input validation to ensure user enters correct values
- Equations are automatically calculated after user enters data
- Include search bar for medication half-lives
- Adding
.addEventListener("input", function)to an input andsetAttribute("min", value)can be used to set the minimum date for a date input based on another date input (to ensure end date is after start date) - Data inputs are not easily formatted
const date = new Date(input.value)can be used to get date values from formdate2.getTime() - date1.getTime()can be used to find the time difference between two dates (the result must be converted from milliseconds to days)- During input validation, nesting can be prevented by returning rather than using an if/else structure
Project is created with:
- JavaScript (ES6)
- HTML 5
- CSS 3
- Thank you to Desmos for offering a free and interactive graph API for development
- Link to API Documentation